Motivation
My task is the predict the departure delay of a flight between the five busiest airports in the USA. As someone who travels frequently between Chicago O’Hare and Houston International airports, I often run into delays, which made me wonder if there was a way to predict this delay when booking a flight. This project is largely important for the almost 200 million people boarding flights from these airports each year. [1] Knowing in advance whether a flight might be delayed and by how much gives customers the ability to make informed decisions when they fly and avoid the headaches that comes with flight delays.
My task is the predict the departure delay of a flight between the five busiest airports in the USA. As someone who travels frequently between Chicago O’Hare and Houston International airports, I often run into delays, which made me wonder if there was a way to predict this delay when booking a flight. This project is largely important for the almost 200 million people boarding flights from these airports each year. [1] Knowing in advance whether a flight might be delayed and by how much gives customers the ability to make informed decisions when they fly and avoid the headaches that comes with flight delays.
Data
The data for this project comes from the Bureau of Transportation Statistics website. It contains the departure and arrival statistics for non-stop domestic flights by major air carriers. More information about the dataset can be found on their website, and the data used for this project can be downloaded from the Documents page. I chose to limit my dataset to flights both leaving and landing at the top five busiest airports in the United States.
I used two primary datasets for this project. One included all flights and had 206629 training examples and 43748 test examples. The second excluded all flights with delays of less than an hour and had 204778 training examples and 47824 test examples.
Features
From the rich feature-set available, I decided to focus exclusively on features that are known when booking the flight:
From the rich feature-set available, I decided to focus exclusively on features that are known when booking the flight:
- Quarter
- Month
- Day of month
- Day of week
- Airline
- Origin airport
- Destination airport
- Departure time
- Flight length
Methods
As previously mentioned, I created two large datasets with about 200,000 examples each. They had unique classes: one included all flights while the other only included on-time flights and flights significantly delayed (more than one hour late). For the dataset containing all flights, I attempted to predict both the class of the flight {onTime, withinHour, greaterThanHour} and the numerical delay. As such, I used two groups of algorithms--one for predicting the delay class and another for predicting the numerical delay. All algorithms were used in Weka.
Class Numerical
Decision Tree x
Nearest Neighbor x
Neural Net x x
Linear Regression x
Results
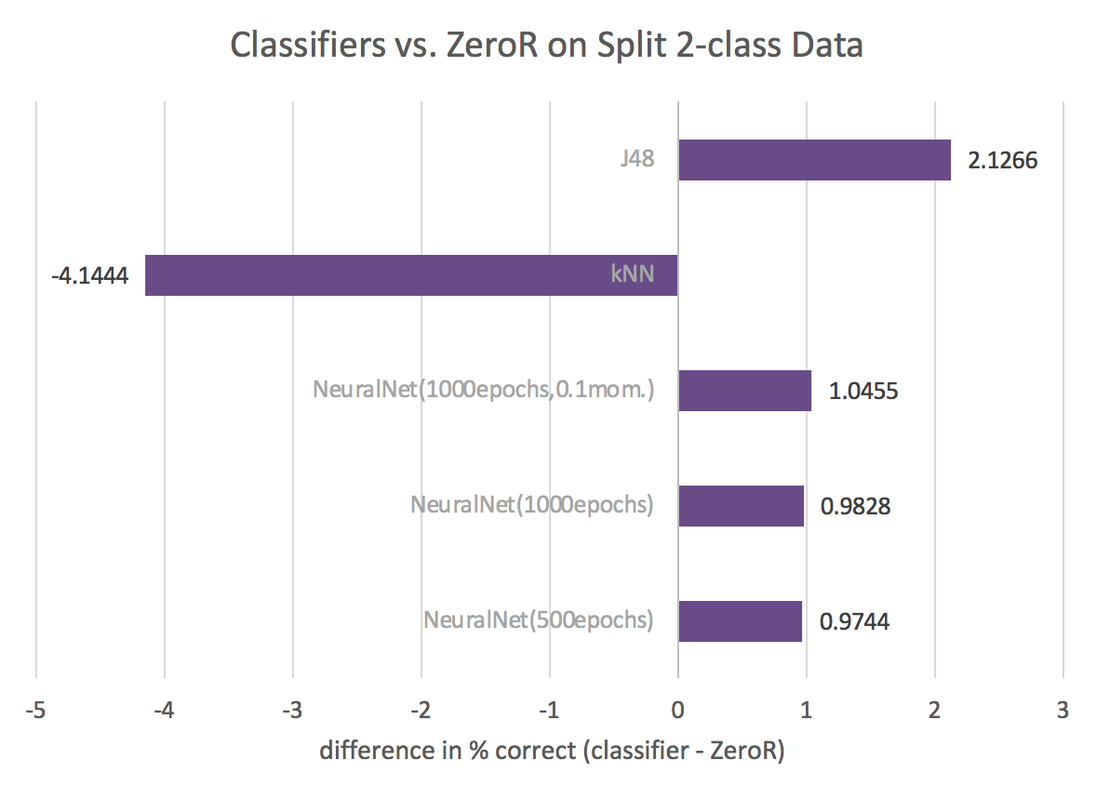
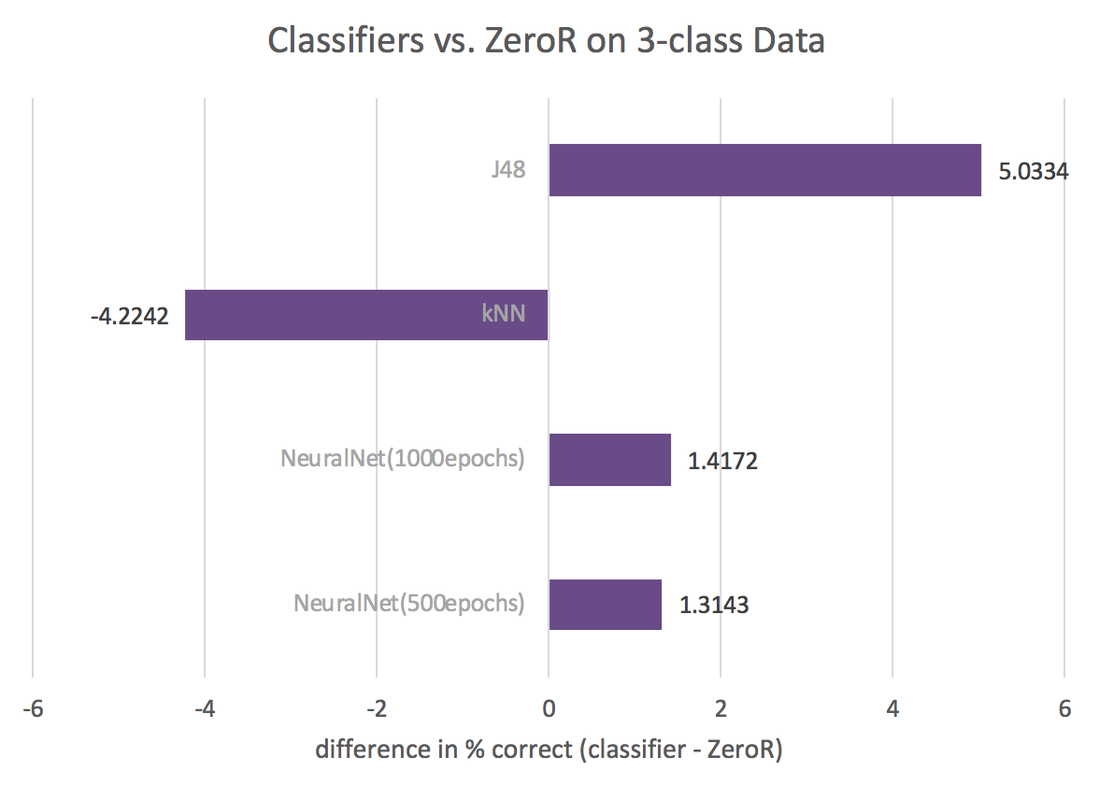
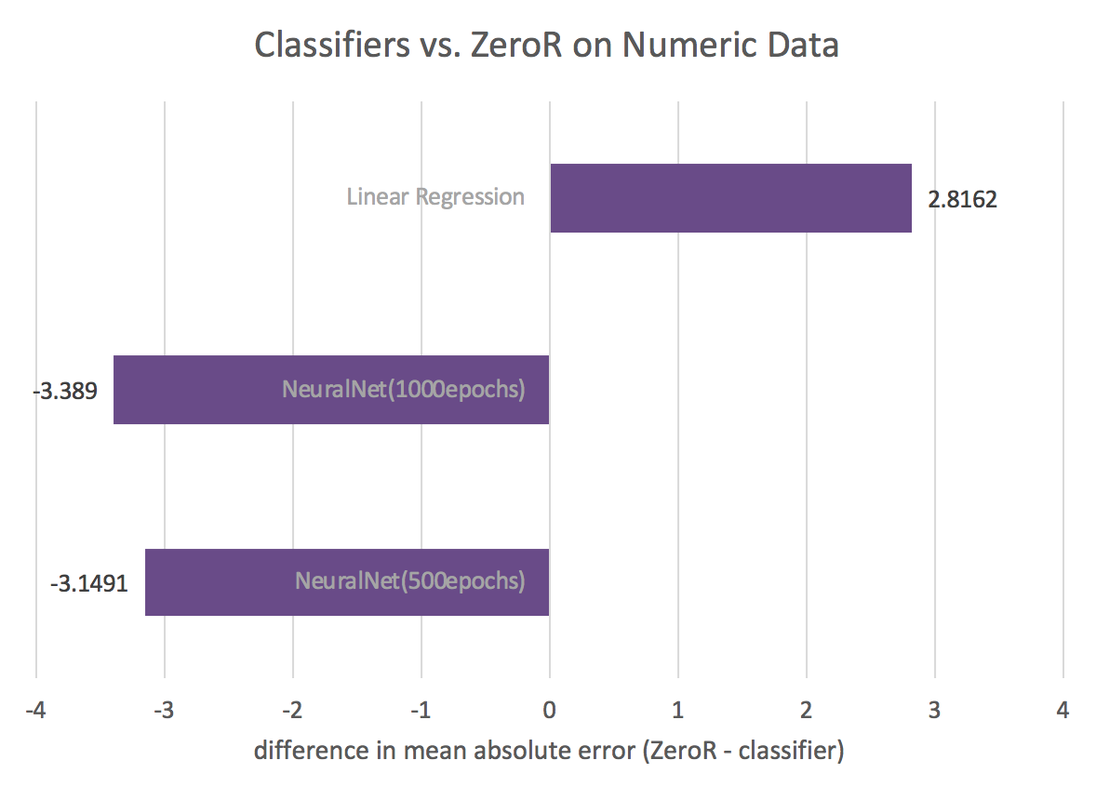
The figures below show accuracy by method for each method used, as compared to ZeroR. Negative values reflect worse performance than ZeroR, while positive values mean better performance. Refer to the report for a more detailed presentation and analysis of these classifiers. Advanced results including the trained models can be downloaded here.
The figures below show accuracy by method for each method used, as compared to ZeroR. Negative values reflect worse performance than ZeroR, while positive values mean better performance. Refer to the report for a more detailed presentation and analysis of these classifiers. Advanced results including the trained models can be downloaded here.
|
|
|